Natural disasters pose serious threats to homes and businesses worldwide. Understanding which mapping materials and tools can help you assess wind, flood, fire, and earthquake hazards is essential for property protection.
🏘️ Why Hazard Mapping Matters for Your Property
Property owners face an increasingly complex landscape of natural hazards. Climate change has intensified weather patterns, making flood zones expand, wildfire seasons lengthen, and storm systems more unpredictable. Earthquake risks remain constant in seismically active areas, while wind damage from hurricanes and tornadoes continues to devastate communities annually.
Hazard mapping materials provide critical intelligence about your property’s vulnerability. These resources combine historical data, geological surveys, weather patterns, and predictive modeling to create comprehensive risk profiles. By understanding your property’s exposure to specific threats, you can make informed decisions about insurance coverage, structural improvements, and emergency preparedness strategies.
The financial implications of ignoring hazard mapping are substantial. Homeowners who fail to assess their risks often face devastating losses when disasters strike. Insurance claims, property devaluation, and reconstruction costs can reach hundreds of thousands of dollars. Conversely, proactive property owners who utilize mapping materials to guide their mitigation efforts typically save significant money while ensuring family safety.
💨 Wind Hazard Assessment Tools and Materials
Wind damage represents one of the most widespread natural hazard threats across the United States and globally. From hurricane-force winds along coastlines to tornado activity in the Great Plains, understanding your property’s wind vulnerability requires specialized mapping resources.
NOAA Wind Zone Maps
The National Oceanic and Atmospheric Administration provides comprehensive wind zone maps that classify regions based on historical wind speeds and frequency. These maps divide territories into zones ranging from minimal risk to extreme exposure, helping property owners understand baseline wind threats. The materials include data on sustained wind speeds, gust potential, and seasonal variation patterns.
Building codes in many jurisdictions reference these NOAA wind zone classifications to establish construction standards. Properties in high-risk zones must meet stricter requirements for roof attachment, window protection, and structural reinforcement. Accessing these maps helps you determine whether your existing structure meets current standards or requires upgrades.
Hurricane Tracking and Prediction Resources
Coastal property owners should familiarize themselves with hurricane tracking materials from the National Hurricane Center. These resources provide real-time storm monitoring, projected paths, and intensity forecasts. Historical hurricane track maps show patterns of storm activity over decades, revealing whether your location sits in a frequently impacted corridor.
The Saffir-Simpson Hurricane Wind Scale offers another essential mapping component. This classification system rates hurricanes from Category 1 through 5 based on sustained wind speeds, with detailed descriptions of expected damage at each level. Understanding which category storms typically affect your area guides appropriate protection measures.
Tornado Risk Mapping
The Storm Prediction Center maintains tornado climatology maps showing historical tornado activity across different regions. These materials display frequency, intensity, and seasonal patterns of tornado occurrence. Properties in “Tornado Alley” and other high-risk zones require different protection strategies than areas with minimal tornado history.
Enhanced Fujita Scale mapping provides additional detail about tornado wind speeds and damage potential in specific locations. This information helps property owners decide whether to invest in safe rooms, reinforced structures, or impact-resistant materials.
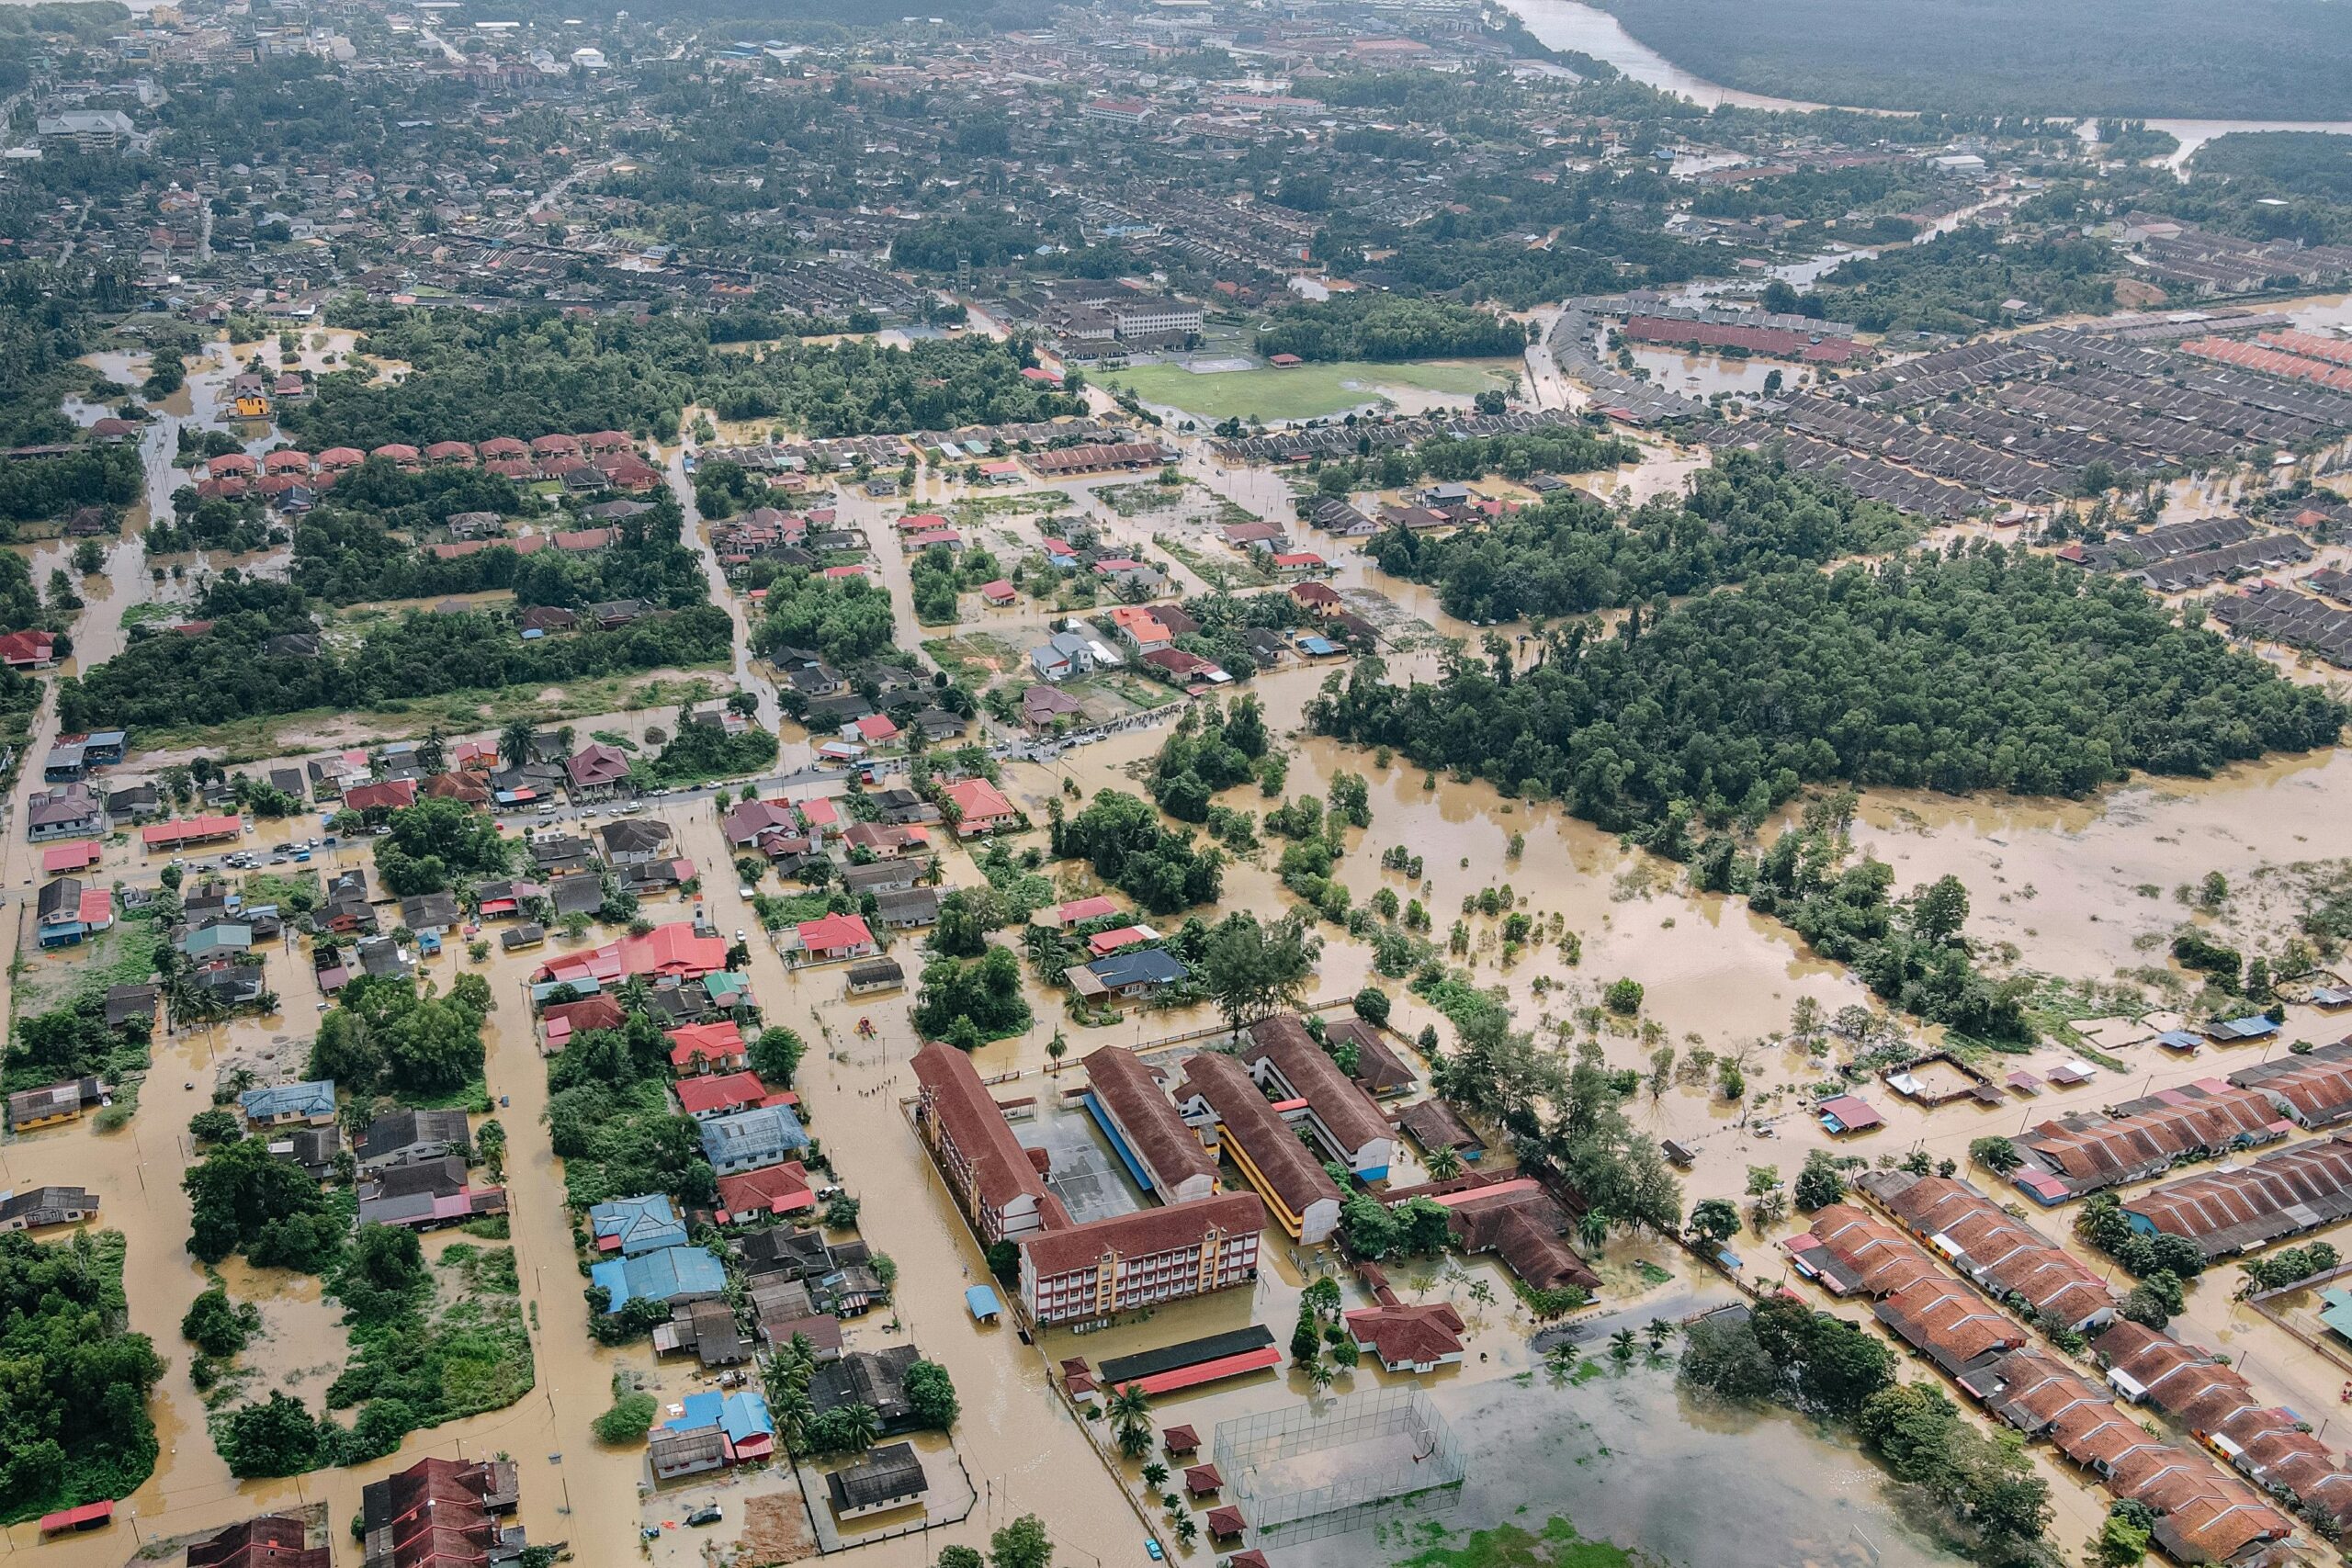
🌊 Flood Hazard Mapping Resources
Flooding causes more property damage annually than any other natural disaster type. Comprehensive flood hazard mapping has become increasingly sophisticated, incorporating multiple data sources to create accurate risk profiles.
FEMA Flood Insurance Rate Maps (FIRMs)
The Federal Emergency Management Agency produces Flood Insurance Rate Maps that designate Special Flood Hazard Areas (SFHAs) throughout the United States. These detailed maps classify properties into zones based on flood probability, with Zone A and V areas facing the highest risk. Property owners in these zones typically require flood insurance for mortgage approval.
FEMA’s Map Service Center provides online access to current and historical FIRMs, allowing you to research your property’s flood classification. The maps include base flood elevation data, floodway boundaries, and coastal high hazard areas. Understanding your property’s specific designation helps determine appropriate elevation requirements and flood-proofing measures.
National Flood Hazard Layer
The National Flood Hazard Layer aggregates flood risk data from multiple sources into a single, accessible platform. This resource includes information beyond FEMA maps, incorporating levee locations, dam inundation areas, and watershed boundaries. The comprehensive view helps property owners understand upstream threats and drainage patterns that affect their land.
Local Watershed and Drainage Maps
Municipal and county governments often maintain detailed watershed maps showing natural drainage patterns, stormwater infrastructure, and areas prone to flash flooding. These local materials provide granular information about how water moves across your specific property during heavy rainfall events.
Topographic maps complement watershed data by revealing elevation changes and natural water flow paths. Properties in depressions, at the base of slopes, or near stream channels face elevated flood risks that broader FEMA maps might not fully capture.
Sea Level Rise Projections
Coastal property owners should consult sea level rise mapping materials that project future flood risks based on climate change scenarios. Organizations like NOAA and Climate Central provide interactive tools showing potential inundation zones under different sea level rise projections. These forward-looking resources are essential for long-term property planning and investment decisions.
🔥 Wildfire Risk Mapping and Assessment
Wildfires have expanded beyond traditional high-risk zones, making comprehensive fire hazard mapping crucial for property owners in both rural and suburban areas. Modern mapping materials incorporate vegetation density, weather patterns, topography, and fire history to create detailed risk profiles.
Wildland Urban Interface (WUI) Maps
The Wildland Urban Interface represents areas where human development meets undeveloped wildland vegetation. Properties in WUI zones face elevated wildfire risk due to their proximity to combustible natural fuels. The U.S. Forest Service and state forestry departments maintain WUI maps identifying these transition zones.
Understanding your property’s WUI classification guides defensible space requirements, vegetation management strategies, and building material choices. Many jurisdictions impose stricter fire-resistant construction standards in designated WUI areas.
Fire Hazard Severity Zone Maps
California’s CAL FIRE agency pioneered Fire Hazard Severity Zone (FHSZ) mapping, which other states have adopted or adapted. These maps classify areas into moderate, high, and very high fire hazard severity zones based on fire behavior modeling. The classifications consider fuel loading, slope, weather, and fire history to predict potential fire intensity.
Property owners in high and very high FHSZ designations face regulatory requirements for vegetation clearance, ember-resistant vents, and ignition-resistant construction materials. Insurance companies also reference these maps when setting premiums and coverage terms.
Real-Time Fire Danger and Monitoring
Beyond static hazard maps, property owners should utilize dynamic fire danger rating systems. The National Fire Danger Rating System provides daily fire risk assessments based on current weather conditions, fuel moisture, and other variables. These materials help you understand when your property faces immediate elevated risk requiring heightened vigilance.
Satellite-based fire detection systems offer real-time monitoring of active fires in your region. Services like NASA’s FIRMS (Fire Information for Resource Management System) and NOAA’s GOES satellite imagery allow property owners to track nearby fire activity and receive early warnings.
🏔️ Earthquake Hazard Mapping Materials
Earthquake risks concentrate in specific geological zones but can occur unexpectedly in regions with limited seismic history. Comprehensive earthquake mapping helps property owners understand ground shaking potential, liquefaction risks, and fault proximity.
USGS Seismic Hazard Maps
The United States Geological Survey produces national seismic hazard maps showing the probability of ground shaking across different regions. These materials display peak ground acceleration values—a measure of earthquake intensity—expected over specific time periods. The maps inform building code requirements and help property owners assess their baseline earthquake exposure.
Interactive versions of USGS seismic hazard maps allow you to input your specific address and receive detailed information about expected ground motion, dominant earthquake scenarios, and contributing fault systems. This personalized data proves more valuable than general regional assessments.
Fault Mapping and Proximity Analysis
Active fault maps identify known earthquake-generating geological structures. Properties located within designated fault zones face restrictions on certain types of development and may require specialized geological studies before construction. State geological surveys maintain detailed fault maps with varying levels of activity classification.
Proximity to active faults directly correlates with earthquake risk severity. Properties within several miles of major fault systems like the San Andreas, Hayward, or Wasatch faults face significantly higher risks than those in more geologically stable areas.
Liquefaction Susceptibility Maps
Liquefaction occurs when saturated soil loses strength during earthquake shaking, causing ground to behave like liquid. This phenomenon can devastate foundations, underground utilities, and structural integrity. Many local governments maintain liquefaction susceptibility maps showing areas with soil conditions prone to this effect.
Properties built on reclaimed land, near water bodies, or in areas with high water tables face elevated liquefaction risks. Identifying this hazard through mapping materials allows property owners to implement appropriate foundation systems and soil stabilization measures.
Tsunami Inundation Maps
Coastal properties in seismically active regions should consult tsunami inundation maps showing potential flooding from earthquake-generated waves. These specialized materials model wave heights and inland penetration distances based on various earthquake scenarios. Evacuation routes and safe zones are typically designated on these maps.
📱 Digital Tools and Applications for Multi-Hazard Assessment
Technology has revolutionized access to hazard mapping materials. Mobile applications and web-based platforms now consolidate multiple hazard types into single interfaces, making comprehensive property assessment more accessible than ever.
FEMA’s National Risk Index
The National Risk Index combines 18 different natural hazard types into a comprehensive risk assessment tool. This free online platform allows property owners to search by address and receive a composite risk score along with detailed breakdowns for individual hazards. The tool considers both hazard likelihood and community vulnerability to provide context-specific risk profiles.
Private Sector Risk Assessment Platforms
Companies like CoreLogic, RMS, and First Street Foundation have developed sophisticated property risk assessment platforms. These services often provide more granular analysis than government resources, incorporating property-specific characteristics, nearby infrastructure, and predictive modeling. While some require subscriptions, they offer valuable insights for high-value properties or commercial real estate.
State and Local GIS Portals
Many state and local governments maintain Geographic Information System (GIS) portals consolidating hazard mapping materials. These platforms allow you to overlay multiple hazard layers, view infrastructure locations, and access detailed parcel information. The combination of datasets provides comprehensive understanding of cumulative risks affecting specific properties.
🛡️ Implementing Mapping Insights into Protection Strategies
Accessing hazard mapping materials represents only the first step in property protection. Translating map data into actionable mitigation measures requires systematic planning and often professional consultation.
Prioritizing Hazards Based on Probability and Impact
Not all hazards warrant equal attention or investment. Use mapping materials to identify which threats pose the highest probability and potential impact for your specific property. A coastal property might prioritize hurricane wind and storm surge protection, while a mountain home focuses on wildfire mitigation and perhaps earthquake reinforcement.
Creating a hazard priority matrix helps organize your protection strategy. List identified hazards from mapping research, assign probability scores based on frequency data, and estimate potential impact on your property. This systematic approach ensures limited resources address the most significant threats first.
Structural Mitigation Measures
Hazard mapping insights should guide specific structural improvements. Wind zone classifications determine appropriate roof reinforcement, window protection, and garage door bracing. Flood elevation data informs decisions about raising structures, installing flood vents, or implementing wet flood-proofing techniques.
Wildfire hazard severity zone designations dictate requirements for ignition-resistant materials, ember-resistant vents, and vegetation management around structures. Seismic hazard levels guide foundation bolting, cripple wall bracing, and water heater strapping decisions.
Landscape and Site Management
Property-level hazard reduction extends beyond structures to encompass site management. Flood hazard maps might reveal the need for improved drainage systems, bioswales, or rain gardens that redirect water away from buildings. Topographic analysis can identify optimal locations for berms or retention ponds.
Wildfire mapping showing vegetation-related risks guides defensible space creation. This includes establishing zones with progressively reduced fuel loads extending from structures into surrounding landscape. Tree spacing, plant selection, and maintenance practices all derive from fire behavior modeling inherent in hazard maps.
Insurance and Financial Planning
Hazard mapping materials directly inform insurance decisions. Properties in designated flood zones require separate flood insurance policies, as standard homeowners insurance excludes flood coverage. Understanding your precise flood zone classification helps you obtain appropriate coverage levels and potentially reduce premiums through elevation certificates or mitigation efforts.
Earthquake insurance availability and cost correlate strongly with seismic hazard maps. Properties in high-risk zones face higher premiums but may benefit significantly from coverage given the catastrophic potential of major earthquakes. Wildfire and wind hazard classifications similarly influence insurance options and costs.
🔄 Keeping Hazard Information Current
Hazard mapping is not a one-time activity. Maps evolve as new data emerges, climate patterns shift, and development alters local conditions. Property owners should regularly review updated mapping materials to ensure their protection strategies remain relevant.
FEMA updates Flood Insurance Rate Maps periodically as communities conduct new flood studies or significant development changes drainage patterns. These updates can reclassify properties into different flood zones, affecting insurance requirements and resale values. Subscribing to notifications from local floodplain administrators ensures you learn about map revisions affecting your property.
Wildfire hazard severity zones undergo periodic reassessment as vegetation patterns change and fire modeling improves. State forestry agencies announce updates to these designations, which may trigger new regulatory requirements or construction standards for affected properties.
Seismic hazard maps receive updates as geological understanding advances and new fault systems are discovered. Major earthquakes sometimes reveal previously unknown fault segments, prompting hazard map revisions for surrounding areas.
🌐 Community-Level Benefits of Hazard Mapping
While individual property owners benefit directly from hazard mapping materials, these resources also support community-wide resilience efforts. Understanding collective vulnerabilities enables coordinated mitigation strategies that protect neighborhoods more effectively than isolated individual actions.
Community wildfire protection plans rely on wildfire hazard mapping to identify priority treatment areas, optimal fuel break locations, and evacuation route vulnerabilities. These collaborative documents guide public and private mitigation investments for maximum community benefit.
Watershed-level flood mitigation requires comprehensive understanding of how water moves through entire drainage basins. Mapping materials showing upstream development, wetland locations, and flow constrictions help communities design green infrastructure and detention facilities that reduce flooding for multiple properties simultaneously.
Seismic retrofit programs targeting vulnerable building types depend on earthquake hazard mapping combined with building inventory data. Communities can prioritize strengthening critical facilities, soft-story structures, and unreinforced masonry buildings in areas facing highest ground shaking potential.

💡 Taking Action: Your Property Protection Roadmap
Begin your hazard assessment by gathering mapping materials for all relevant hazard types in your area. Start with federal resources like FEMA flood maps, USGS seismic hazard maps, and NOAA wind data. Supplement these with state and local materials providing greater detail for your specific region.
Document your findings in an organized hazard profile for your property. Note specific zone classifications, proximity to hazard sources, and historical events affecting your area. This documentation proves valuable for insurance discussions, real estate transactions, and mitigation planning.
Consult with professionals who can interpret mapping materials in the context of your specific property characteristics. Structural engineers, landscape architects, and hazard mitigation specialists bring expertise that translates map data into practical recommendations. Many local emergency management agencies offer free or low-cost property assessments.
Develop a phased implementation plan addressing high-priority hazards first while budgeting for longer-term mitigation projects. Some improvements like vegetation management and basic emergency supplies require minimal investment, while structural retrofits or elevation projects need careful financial planning.
Share hazard mapping insights with neighbors to build community awareness and potentially coordinate mitigation efforts. Collective action often achieves better results and cost savings than individual initiatives, particularly for landscape-scale hazards like wildfire and flooding.
Natural hazards will continue threatening properties, but knowledge transforms vulnerability into preparedness. Hazard mapping materials provide the foundation for informed decision-making about protection investments, insurance coverage, and emergency planning. By understanding your property’s specific risks through comprehensive mapping analysis, you gain power to implement targeted mitigation measures that safeguard your investment, protect your family, and contribute to broader community resilience. The time invested in hazard mapping research pays dividends when the inevitable wind, flood, fire, or earthquake event occurs, potentially making the difference between minor inconvenience and catastrophic loss.