In an era where digital mapping drives countless decisions daily, understanding how failure informs success has become essential for creating resilient, trustworthy navigation systems.
🗺️ Why Failure Data Transforms Modern Mapping Systems
Every time a GPS navigation system miscalculates a route, every instance when a map displays incorrect business information, and every moment a location pin drops in the wrong place represents valuable data. These failures, rather than being swept under the digital rug, have become goldmines for engineers and cartographers working to build stronger, more resilient mapping platforms.
The traditional approach to cartography focused primarily on getting things right the first time. However, modern digital mapping operates in a fundamentally different landscape. Real-time updates, crowdsourced information, and algorithmic route optimization create countless opportunities for errors to emerge. The key difference between legacy systems and contemporary mapping solutions lies not in preventing all errors, but in systematically learning from them.
Organizations like Google Maps, OpenStreetMap, and Waze have pioneered methodologies that treat failure data as a critical resource. When millions of users interact with mapping systems daily, the collective feedback loop generates insights that no amount of pre-launch testing could replicate. This paradigm shift has revolutionized how we think about cartographic accuracy and system resilience.
The Architecture of Failure Collection in Navigation Systems
Building resilient maps requires sophisticated infrastructure designed specifically to capture, categorize, and analyze failure data. Modern mapping platforms employ multiple layers of failure detection mechanisms that work simultaneously to identify problems before they cascade into larger issues.
Automated Error Detection Systems
Machine learning algorithms constantly monitor mapping data for anomalies. These systems compare expected patterns against actual user behavior. When a significant number of users deviate from suggested routes in similar ways, the system flags potential mapping errors. This might indicate anything from a new road construction project to a permanently closed street that hasn’t been updated in the database.
GPS trajectory analysis provides another critical data source. By examining the paths vehicles actually take versus the routes suggested by the mapping algorithm, systems can identify discrepancies that point to mapping inaccuracies. If dozens of drivers consistently ignore a turn recommended by the navigation system, there’s likely a problem with how that intersection is represented in the map data.
Crowdsourced Failure Reporting
User-generated reports constitute one of the most valuable streams of failure data. When drivers actively report issues like incorrect speed limits, missing exits, or closed businesses, they provide specific, actionable intelligence that automated systems might miss. The challenge lies in filtering genuine reports from noise and prioritizing corrections based on impact and frequency.
Community mapping projects like OpenStreetMap have demonstrated how distributed verification can strengthen map resilience. When multiple independent editors review and validate the same geographic feature, the collective intelligence reduces error rates significantly. This collaborative approach to failure correction creates self-healing systems that improve continuously.
🔍 Categorizing Failure Types for Maximum Learning
Not all mapping failures carry equal weight or require identical responses. Sophisticated mapping platforms classify errors into distinct categories, each demanding different remediation strategies and offering unique insights for system improvement.
Critical Navigation Errors
These failures directly impact safety and usability. Examples include routing drivers the wrong way on one-way streets, suggesting illegal turns, or directing pedestrians across highways without crosswalks. Such errors demand immediate correction and trigger investigations into how they bypassed quality control measures.
Critical errors often reveal gaps in data validation pipelines. Perhaps a recent map update introduced new geometric data without properly checking directional restrictions. Maybe an algorithmic change prioritized route efficiency over safety considerations. Each critical failure becomes a case study that strengthens the entire system against similar future problems.
Data Staleness Issues
Maps become outdated the moment they’re published. Businesses close, roads undergo construction, and urban landscapes evolve constantly. Staleness errors occur when map data fails to reflect current conditions. While individually less severe than critical navigation errors, accumulated staleness significantly degrades user trust and system utility.
Tracking staleness patterns helps organizations optimize their data refresh cycles. If certain business categories consistently show high closure rates, the system can prioritize more frequent verification of those locations. Geographic areas experiencing rapid development might require monthly updates rather than annual refreshes.
Edge Case Failures
Some mapping failures only emerge under specific, unusual circumstances. A routing algorithm might perform flawlessly for 99.9% of queries but fail spectacularly when users request directions from extremely remote locations during specific weather conditions. Edge cases challenge developers to build more robust systems that gracefully handle unexpected inputs.
Collecting edge case data requires persistent monitoring even of rare events. When these uncommon failures occur, they often expose fundamental architectural weaknesses that could cause problems elsewhere. A system that crashes when calculating a route across certain international borders might have underlying issues with coordinate system transformations that affect accuracy in other contexts.
From Data to Action: Implementing Failure-Driven Improvements
Collecting failure data provides no value unless organizations systematically translate insights into concrete improvements. The most resilient mapping systems employ structured workflows that transform error reports into actionable fixes and long-term system enhancements.
Rapid Response Protocols
High-priority failures trigger automated rapid response systems. When multiple users report the same critical error within a short timeframe, the system can temporarily flag the affected area, warning other users of potential issues while human reviewers investigate. This interim measure prevents a single error from impacting thousands of users before correction.
Automated fixes represent the next evolution in failure response. For certain well-understood error types, systems can now implement corrections autonomously, subject to subsequent human verification. If twenty users report a business closure and no conflicting data exists, the algorithm can provisionally update the map status while queuing the change for manual review.
Root Cause Analysis Frameworks
Individual error correction addresses symptoms; root cause analysis cures diseases. When patterns emerge across multiple failure instances, dedicated teams investigate underlying systemic issues. Perhaps a particular data import process consistently introduces formatting errors. Maybe a specific algorithmic assumption breaks down in mountainous terrain.
Effective root cause analysis requires cross-functional collaboration. Engineers examine code logic, data scientists analyze statistical patterns, cartographers review geographic data quality, and user experience researchers interpret how failures affect real-world usage. This multidisciplinary approach uncovers connections that single-perspective analysis would miss.
⚙️ Technical Infrastructure Supporting Failure Resilience
Building systems that effectively harness failure data requires substantial technical investment. The infrastructure must scale to handle billions of data points while remaining flexible enough to adapt as new failure patterns emerge.
Real-Time Data Processing Pipelines
Modern mapping platforms process failure reports in near-real-time. Stream processing frameworks ingest user reports, GPS traces, and system logs simultaneously, correlating information across sources to identify problems quickly. A single user report gains significance when correlated with unusual GPS trajectory patterns and social media mentions of road closures in the same area.
Distributed computing architectures enable this processing scale. By partitioning geographic data across multiple servers and processing regional failure data locally, systems achieve the responsiveness needed for timely corrections. Geographic load balancing ensures that heavily-used urban areas receive computational resources proportional to their error volume and user impact.
Machine Learning for Pattern Recognition
Artificial intelligence transforms raw failure data into actionable intelligence. Supervised learning models trained on historical error corrections can predict which new reports indicate genuine problems versus user confusion or temporary conditions. Unsupervised clustering algorithms identify emerging failure patterns that haven’t been explicitly programmed into detection systems.
Natural language processing analyzes free-text user reports, extracting structured information from informal descriptions. When users write “the restaurant is gone, now it’s a pharmacy,” NLP systems extract both the business closure and the replacement, updating map data comprehensively from a single report.
Building Trust Through Transparent Failure Handling
How organizations communicate about mapping failures significantly impacts user trust. Transparency about known issues, clear explanations of correction processes, and visible improvements stemming from user feedback foster community engagement and forgiveness when errors occur.
Status dashboards that publicly display known mapping issues in specific regions demonstrate accountability. Users appreciate knowing that reported problems are acknowledged and being addressed. Time-to-fix metrics provide concrete evidence of organizational responsiveness, building confidence that the system continuously improves.
Gamification of failure reporting encourages participation. When users see their contributions credited and understand how their reports improved the map for everyone, they become invested stakeholders rather than passive consumers. Leaderboards, achievement badges, and public recognition transform error reporting from complaint to collaboration.
📊 Measuring Resilience: Key Performance Indicators
Quantifying map resilience enables organizations to track improvement over time and identify areas needing additional focus. Effective metrics balance multiple dimensions of quality, accuracy, and responsiveness.
| Metric | Definition | Target |
|---|---|---|
| Mean Time to Detection (MTTD) | Average time between error introduction and identification | <24 hours for critical errors |
| Mean Time to Resolution (MTTR) | Average time from error detection to correction deployment | <72 hours for high-priority issues |
| Error Recurrence Rate | Percentage of corrected errors that reappear within 90 days | <2% |
| User Report Quality Score | Proportion of user reports leading to actual corrections | >60% |
| Geographic Coverage Balance | Variation in error rates across different regions | <15% standard deviation |
These metrics provide objective benchmarks for resilience, but qualitative measures matter equally. User satisfaction surveys, narrative feedback analysis, and comparative studies against competitor platforms offer complementary perspectives on mapping quality and reliability.
Case Studies: Learning from Failure at Scale
Real-world examples illuminate how failure data transforms mapping systems. When Google Maps initially launched turn-by-turn navigation, early routing algorithms occasionally suggested technically shortest routes that proved impractical or dangerous. User feedback highlighting these issues drove algorithmic refinements that now consider road classification, typical traffic patterns, and safety factors alongside pure distance calculations.
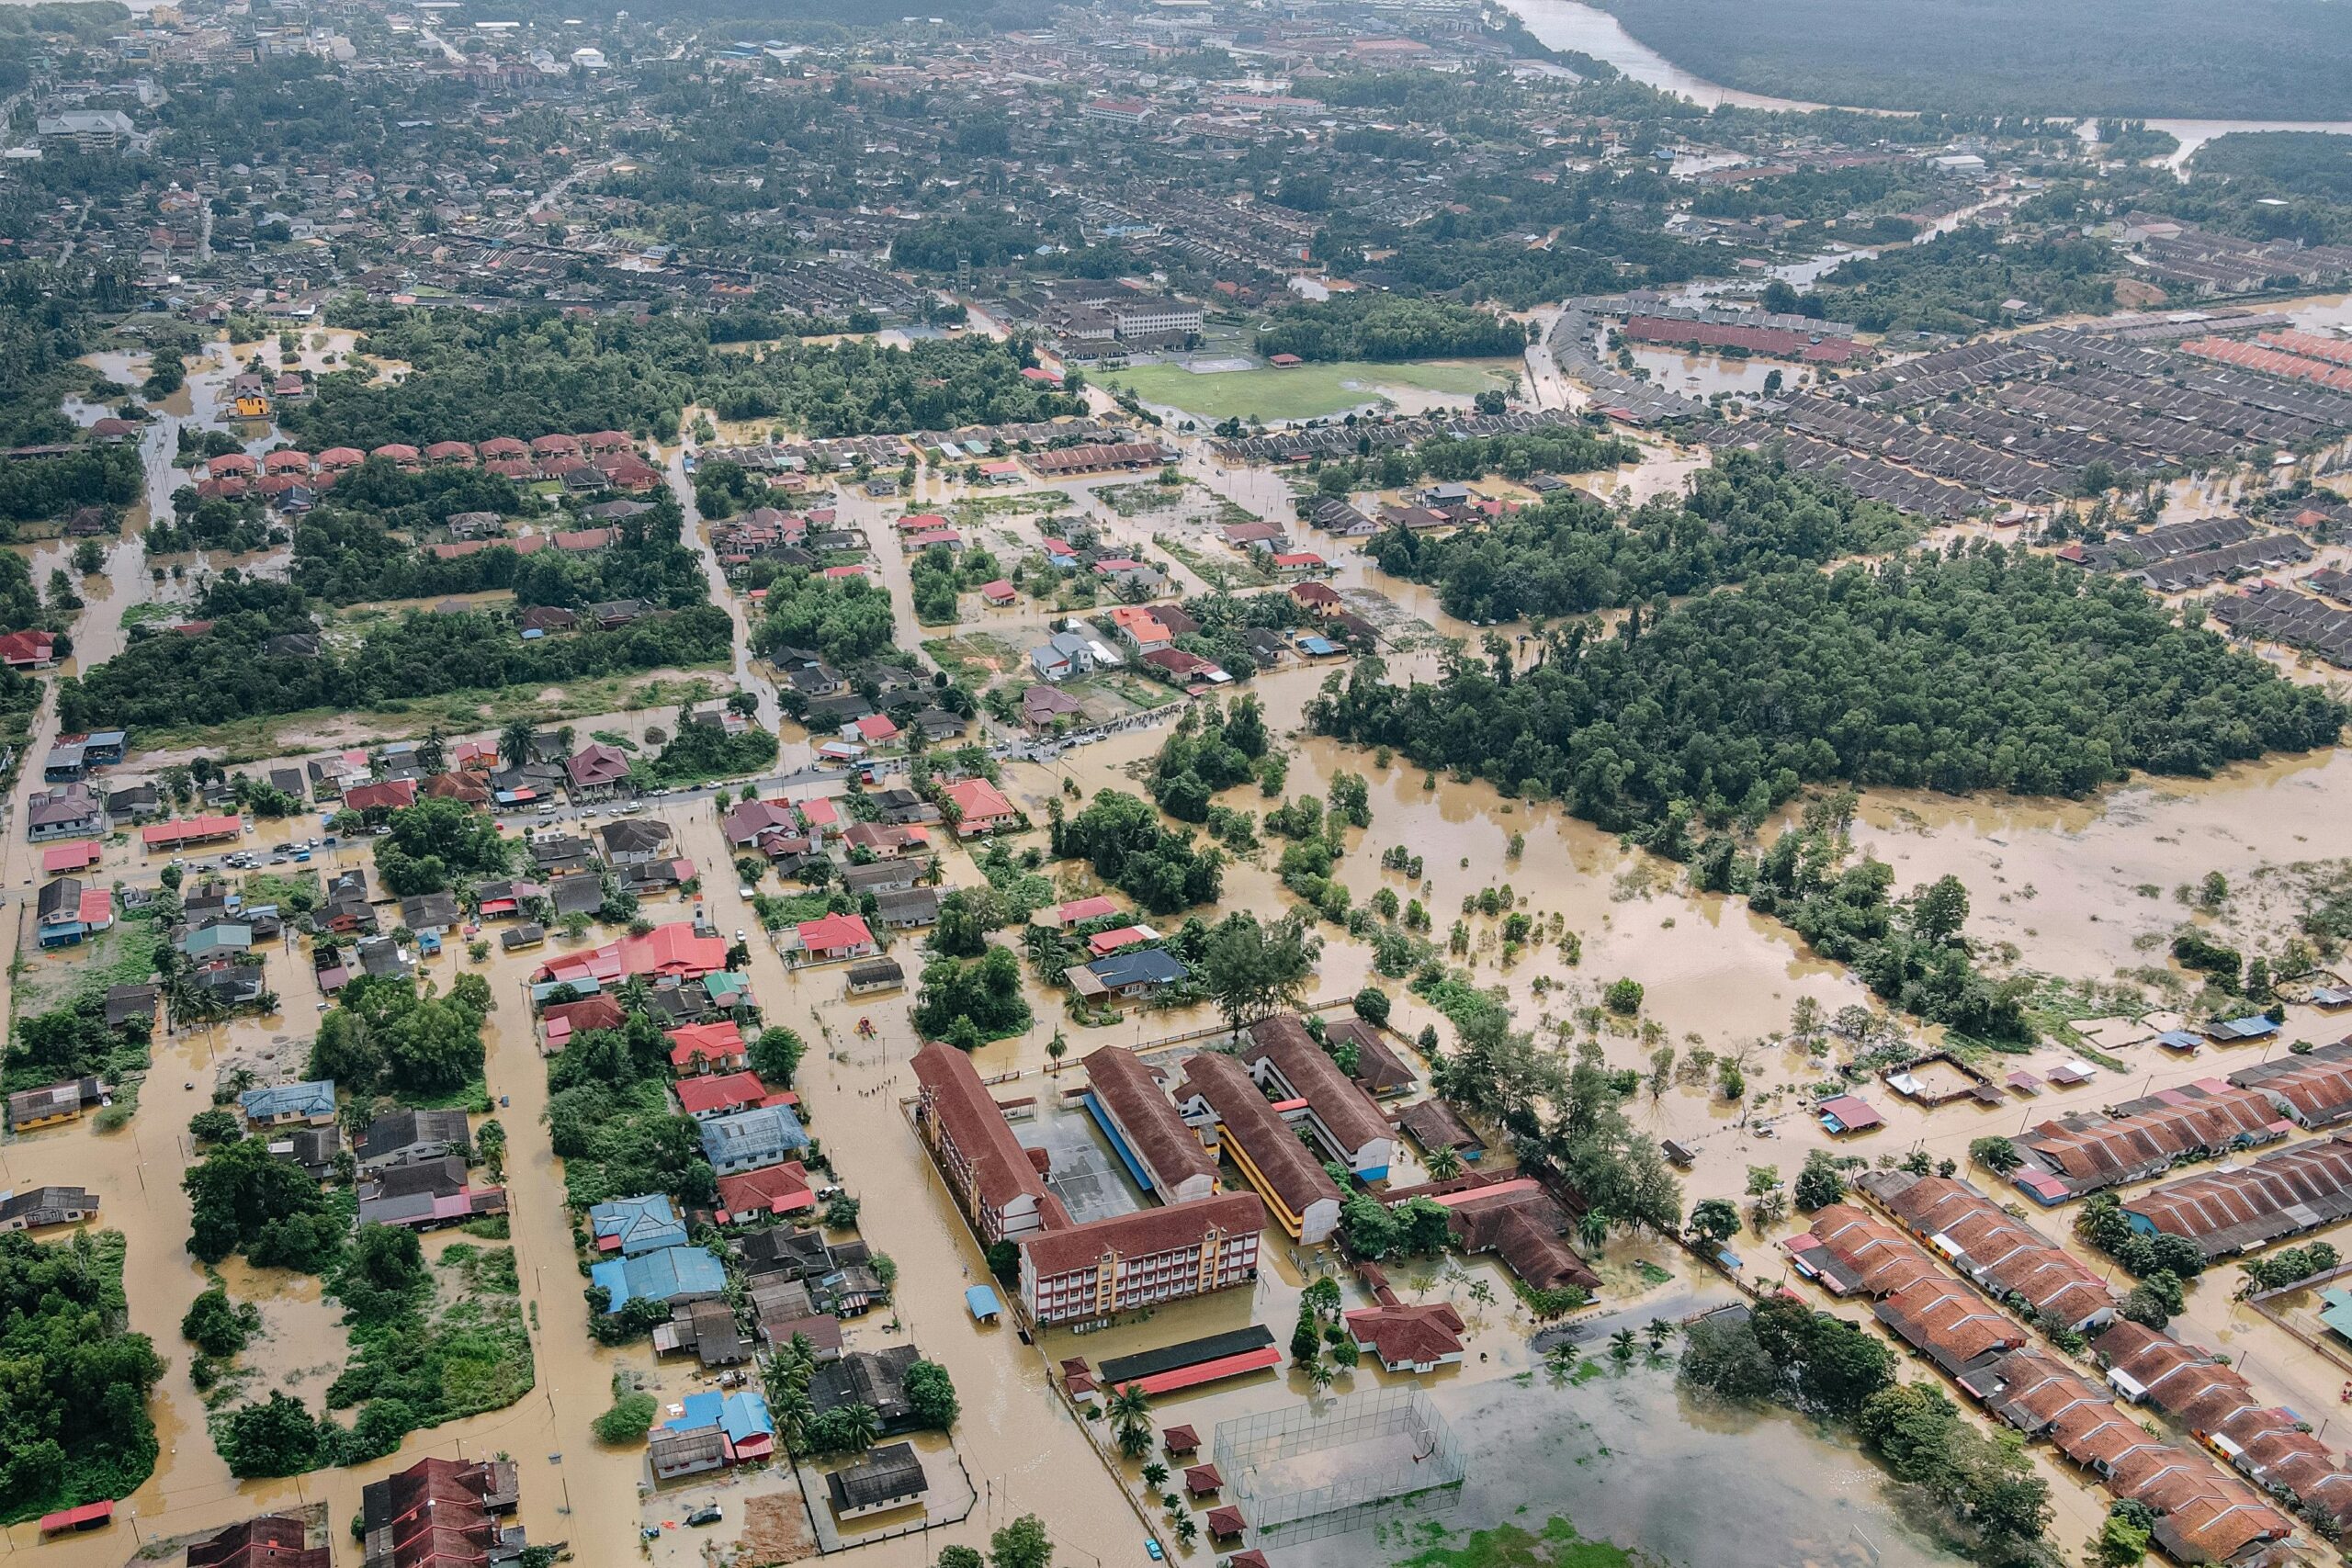
OpenStreetMap’s response to natural disasters demonstrates failure resilience in action. After earthquakes, hurricanes, or floods dramatically alter geographic landscapes, the platform’s distributed volunteer network rapidly updates affected areas using satellite imagery and on-ground reports. The system’s flexibility in accepting rapid changes, even with reduced verification standards during emergencies, shows how failure modes inform adaptive processes.
Waze pioneered real-time, user-driven failure correction by treating every driver as a potential data source. When the community reports accidents, police presence, or hazards, the system immediately adjusts routing for all users. This approach acknowledges that maps fail constantly in the face of dynamic real-world conditions, building resilience through continuous adaptation rather than attempting perfect initial accuracy.
🚀 Future Directions: Predictive Resilience and Proactive Mapping
The next generation of resilient mapping systems will anticipate failures before they occur. Predictive analytics analyzing historical failure patterns, seasonal variations, and urban development trends will enable proactive map updates. If data shows that construction projects consistently lead to routing errors in specific circumstances, systems will flag similar future projects for enhanced monitoring.
Integration with Internet of Things sensors will provide real-time ground truth data. Smart traffic lights, connected vehicles, and municipal infrastructure systems will continuously validate map data, identifying discrepancies immediately. This creates closed-loop systems where the physical environment itself participates in maintaining mapping accuracy.
Augmented reality mapping introduces new failure modes while offering unprecedented correction opportunities. When AR systems overlay navigation information on live camera feeds, computer vision can verify that digital representations match physical reality. Discrepancies become instantly apparent, enabling automatic error detection that doesn’t rely on user reports.
The Cultural Shift: Embracing Imperfection as Path to Excellence
Organizations building resilient maps must cultivate cultures that view failures as opportunities rather than embarrassments. Blameless post-mortems that focus on systemic improvements rather than individual accountability encourage honest reporting and thorough investigation. When teams feel safe acknowledging errors, problems surface quickly instead of being hidden until they cause major issues.
Cross-organizational learning accelerates resilience building. Industry conferences, published research, and open-source collaborations allow different mapping platforms to learn from each other’s failures. While competitive pressures create some secrecy, the mapping community increasingly recognizes that collective safety and accuracy improvements benefit everyone.
Practical Implementation: Starting Your Failure Data Journey
Organizations seeking to harness failure data for mapping resilience should begin with clear objectives and realistic expectations. Start by implementing comprehensive logging that captures not just what went wrong, but the context surrounding failures. User sessions, environmental conditions, and system states at failure moments provide crucial diagnostic information.
Establish feedback channels that make reporting errors effortless. In-app reporting buttons, community forums, and social media monitoring create multiple pathways for failure information to reach your team. Lower barriers to reporting increase data volume and diversity, capturing problems that might otherwise go unnoticed.
Prioritize failures based on frequency and impact rather than attempting to fix everything simultaneously. A systematic triage process ensures resources focus where they’ll provide maximum resilience improvement. Quick wins that address common, high-visibility errors build momentum and demonstrate value to stakeholders.

🎯 Synthesizing Failure Intelligence Into Living Maps
The ultimate goal of collecting and analyzing failure data extends beyond error correction. Truly resilient maps evolve continuously, treating each user interaction as a potential data point that refines understanding of the physical world. These living maps acknowledge their own imperfections while maintaining utility through rapid adaptation and transparent communication.
Success comes not from eliminating all failures—an impossible standard in complex, dynamic systems—but from building mechanisms that detect, correct, and learn from errors faster than they accumulate. This race between failure introduction and correction defines modern mapping resilience. Organizations that treat failure data as a strategic asset rather than an unfortunate byproduct position themselves to lead in an era where adaptability trumps initial perfection.
The journey toward stronger maps through failure data never truly ends. As navigation systems expand into autonomous vehicles, drone delivery, and indoor positioning, new failure modes will emerge. The principles remain constant: observe honestly, analyze deeply, correct swiftly, and share learnings broadly. Maps built on these foundations become more than tools—they become resilient systems that improve through use, strengthened by every mistake they overcome.